
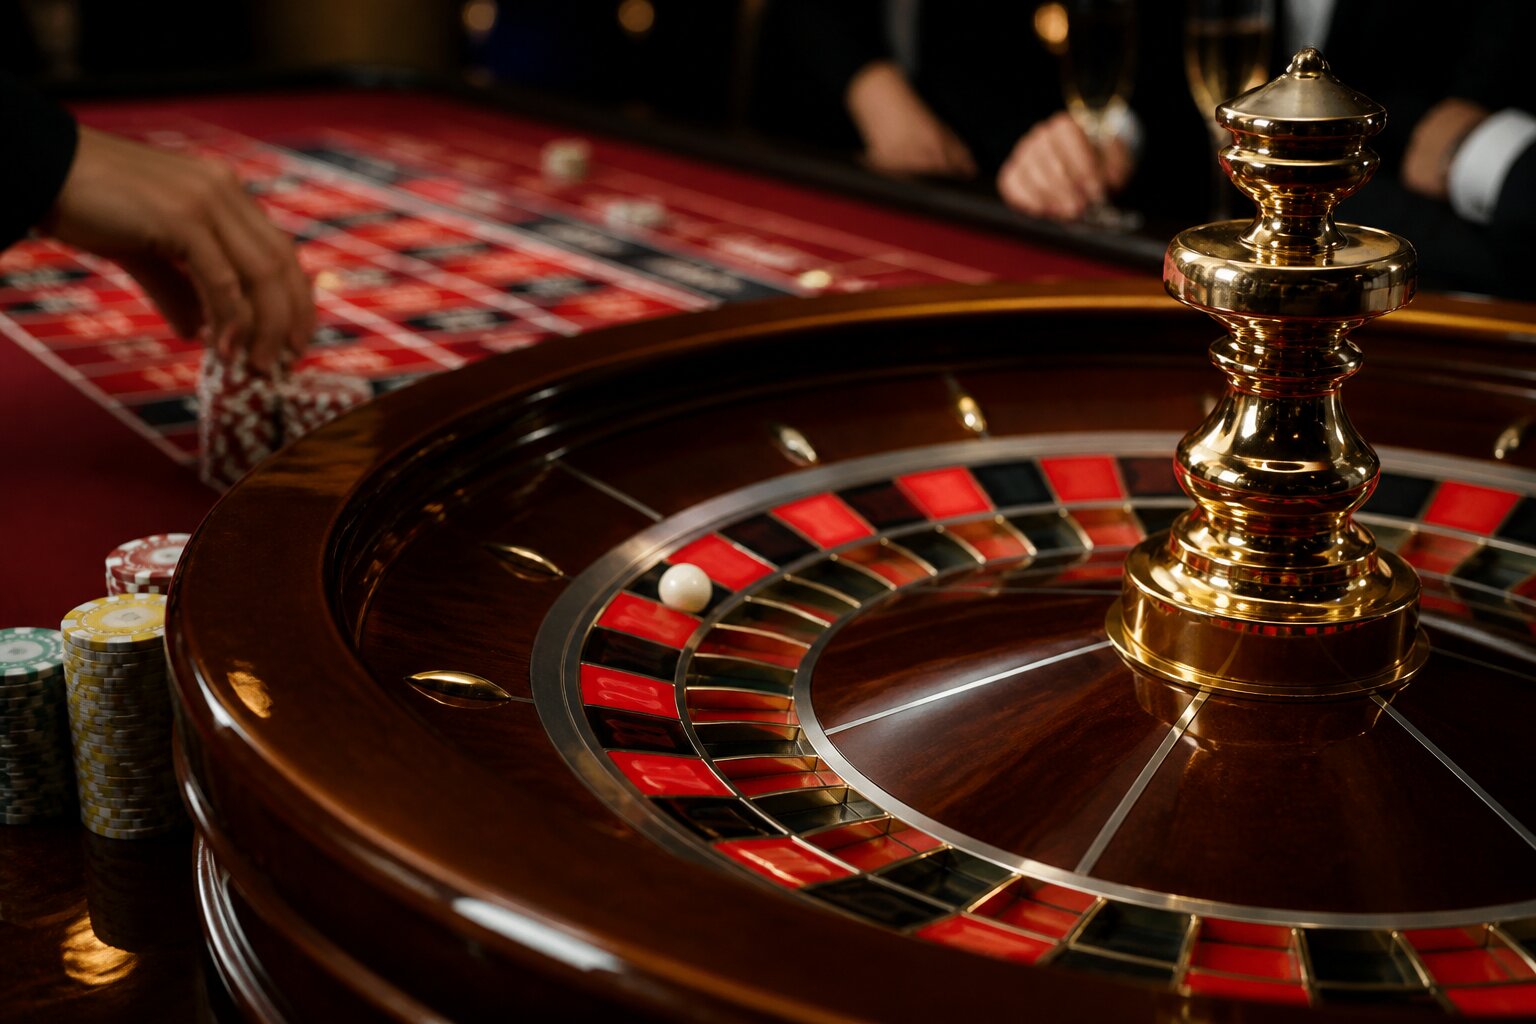
Ever wondered why red sometimes seems to come up again and again at the roulette table? Those runs catch the eye and invite questions about how often they should happen.
Understanding the odds behind consecutive reds reveals what the numbers actually say about the game. Whether you’re a curious beginner or an experienced player, a clearer picture of the probabilities can change how you think about streaks.
Stick with me as we break down the maths and practical meaning of multiple reds in a row — the explanation is simpler than it looks and worth knowing before you place a bet.
How Are The Odds Of Consecutive Reds Calculated?
The maths behind consecutive reds is straightforward because each spin is an independent event. In European roulette there are 18 red pockets, 18 black and one green zero, so a single spin has a probability of red equal to 18/37.
To find the probability of red appearing on two consecutive spins you multiply that single-spin probability by itself: (18/37) × (18/37). For three in a row you multiply it three times, and so on. This power rule applies for any number of consecutive spins.
This approach shows why longer streaks become progressively less likely: you are raising a number smaller than one to a higher power. No betting system can change these mathematical odds.
Odds On A European Wheel (Single Zero)
On a European wheel the single-spin chance of red is 18/37, which is about 48.65%. Each spin is independent, so the probability of a sequence is the product of the individual spin probabilities. Squaring 18/37 gives the probability for two reds in a row, roughly 23.68%. For three reds it falls further to about 11.52%.
As an illustration:
- Four consecutive reds: (18/37)^4 ≈ 5.6%
- Five consecutive reds: (18/37)^5 ≈ 2.7%
These percentages are rounded, and the exact fractions come from repeated multiplication of 18/37. Because outcomes are independent, previous spins do not influence future spins; the chance of red on the next spin remains 18/37 regardless of any streak.
The house edge on a European wheel comes from the single zero and is 2.7%. That edge is built into every bet and does not change with streaks or previous outcomes. It is reflected in the long‑run average return to players and is the reason casino odds favour the house over time.
Now that you have seen how the European odds scale, it is useful to compare them with the American layout.
Odds On An American Wheel (Double Zero)
The American wheel has 38 pockets: 18 red, 18 black and two green slots (0 and 00). That means the single-spin probability of landing on red is 18/38, which is about 47.37%. This is noticeably lower than the 50% people often expect from a red-or-black outcome.
When calculating the chance of consecutive results we treat each spin as independent, so we multiply the single-spin probability for each spin. The rounded probabilities for repeated red outcomes are:
- Two reds: (18/38)^2 ≈ 22.43%
- Three reds: (18/38)^3 ≈ 10.63%
- Four consecutive reds: (18/38)^4 ≈ 5.03%
- Five consecutive reds: (18/38)^5 ≈ 2.38%
These figures are rounded to two decimal places and assume fair, independent spins. They illustrate how quickly the likelihood falls as you require more consecutive identical outcomes.
Because of the extra green slot, the house edge on an American wheel is higher than on a European wheel. The house edge on American double-zero roulette is about 5.26%, which slightly reduces the long-run chances of winning simple colour bets compared with single-zero wheels.
What Is The Probability Of N Reds In A Row?
To find the probability of N reds in a row, take the single-spin probability of red and raise it to the power N. For a European wheel that is (18/37)^N; for an American wheel it is (18/38)^N.
Each spin is independent, so previous results do not change the chance of the next spin landing red. That is why you multiply the single-spin probability by itself N times rather than adjusting it after each spin.
For example, on a European wheel:
- 1 red: (18/37)^1 ≈ 48.65%
- 2 reds: (18/37)^2 ≈ 23.68%
- 4 reds: (18/37)^4 ≈ 5.6%
- 6 reds: (18/37)^6 ≈ 1.33%
The formula works for any N and is the most direct way to quantify how rapidly the odds fall as a streak lengthens. Because the base probability is below 1, the probability decreases exponentially as N increases, meaning long streaks become very unlikely quite quickly.
If you prefer quick checks rather than doing the maths, the next section outlines some simple alternatives.
How Often Do Long Red Streaks Occur In Practice?
Long runs of red do occur, but their frequency drops sharply with each added spin. For instance, a streak of six reds on a European wheel happens with a probability of about 1.33%, which in practical terms means you would expect to see one such streak roughly once every 75 tries of six spins.
An eight-red streak is far less common — roughly 0.27% — so it will appear only occasionally in routine play. These outcomes arise from independent spins and the probabilities shown earlier; past results do not alter future ones.
If you find yourself reacting strongly to streaks, it’s sensible to keep bets and losses within limits and take breaks when needed. That helps keep play controlled and purposeful.
How To Calculate Odds Quickly Without Maths
If you don’t want to work through the formula, there are quicker ways to check probabilities without changing the underlying maths.
Some online roulette pages include probability charts that list common outcomes for red, black and other bets, which make it easy to read off the chance for short streaks. There are also simple calculators and apps where you select the wheel type and enter the number of consecutive reds to get an instant probability.
In live or online games you may also find a stats panel showing recent results; these are useful for quick reference but they reflect past spins only and don’t alter the independent probability of the next spin.
Whichever method you use, remember the house edge remains in force and no shortcut alters the mathematical odds. If you’re browsing options on the site, keep your staking in line with the limits you’ve set for yourself.
Final note: the numbers above are the clearest guide to what to expect from streaks, and keeping those probabilities in mind makes it easier to interpret what happens at the table.
**The information provided in this blog is intended for educational purposes and should not be construed as betting advice or a guarantee of success. Always gamble responsibly.